Voice Management Guide
The Voice Management user guide
- To start
- Prerequisite
- Home
- Administrator
- Importing sounds to your IVR
- Creating a routing
- Importing a directory
- Prohibit transfers to certain numbers
- Creation of a skill group
- Creation of an operator toolbar
- Gestion of an operator
- Creation of an IVR
- Satisfaction survey
- Campaign
- Gestion of a supervisor
- Webcallback
- Link WebCallBack
- Generating a WebCallBack link
- SMS service
- SMS in the operator toolbar
- SMS in the operator toolbar
- Statistics
- Operator
- Supervisor
- Technical side
- API
- SSO authentification
- Call recording
- Integration
- Application setup (Microsoft Dynamics)
- easiware integration
- Salesforce
- Zendesk
Communication statistics
1 - User page
Find a new tab ‘Communication Stats’ in the right-hand menu that gives access to a new statistics page on your communication data.
The page consists of a calendar (1) to filter the data, a summary table of all transfer statistics (2), and two charts (3)
The term 'communication' refers to the interaction between an agent or operator and the calling client. This concept differs from call summary. In the context of call transfers, multiple communications may occur for a single call, with each call identified by a unique ID.
These communication data constitute the source of calculations related to performance indicators such as Average processing time, Average communication time, or transfer rate. You can find these indicators on this dedicated page.
It should be noted that processing times correspond to the time taken by the operator to process the call (Processing time = communication time (including on-hold time) + catchup time + post-call pause time).
The calendar

Filter the data to display on the page using the calendar. You can enter a period directly in the “dates” fields or select a day/period through the calendar.
By default, the calendar will always display the last 7 days. If you want to go back to the default dates, click “Reset”.
The summary table

The first table on the page provides you with raw communication data. You can display only the data that interests you by clicking on the “Fields” arrow on the right. The list of fields displayed in the list will appear.
You also have the option to export the table in different formats.
The data in graphs

Visualize your data at a glance via graphs. You have the option to view communication data by date, by operator, by group, by time, and more.
Each graph can be modified in type (columns, lines, curves, etc.), and can also be transformed into a simple table or a pivot table to meet your needs and context.
2 - List of analyzable data
| Data name | Explanations |
| Service number | Called service number |
| Call ID | Unique identifier of the call |
| Date | Date of the call |
| Group name | Name of the skill group of the operator who answered the call |
| Operator email | Email of the operator who answered the call |
| Operator name | Name of the operator who answered the call |
| Time | Time of the call |
| Wait time | Time the caller waited before the operator answered |
| Ring time | Time the operator’s phone rang before they answered |
| Communication time | Time the operator and the caller interacted. This includes the time the operator put the caller on hold. |
| Operator hold time | Time during which the operator put the caller on hold. This time is included in the communication time. |
| Catchup time | Effective catchup time for this interaction |
| Post-call time | Effective post-call pause time triggered by the operator. |
| Processing time | Processing time of the call by the operator (Processing time = Communication time (including hold time) + Catchup time + Post-call pause time). |
| Transferred | Was the call transferred by the operator? |
| id (not initially displayed but available) | technical identifier of this communication |
| Group ID (not initially displayed but available) | Technical identifier of the group |
| Operator ID (not initially displayed but available) | Technical identifier of the operator who was solicited |
| Transfer ID (not initially displayed but available) | Technical identifier of the transfer |
3 - API Page
Find our corresponding API documentation directly on our Guide.
4 - Inscription aux rapports par emails

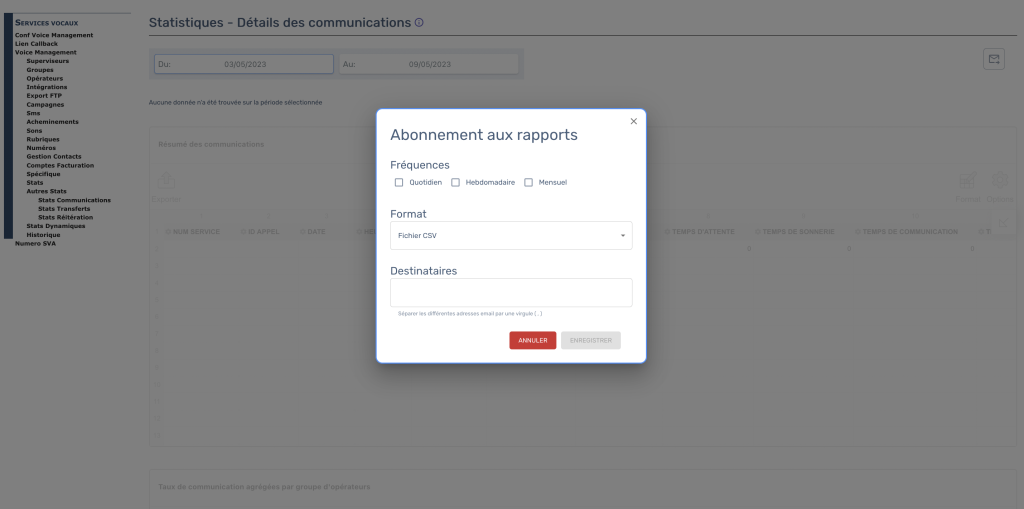
Abonnez-vous aux rapports pour recevoir par email le premier tableau de chaque page de statistiques.
Vous avez la possibilité de vous abonner :
– Fréquence : Quotidien, Hebdomadaire, Mensuel
– Format : CSV, Excel, PDF
– Vous avez la possibilité de mettre plusieurs adresses emails, que vous devez séparer par des virgules.
- Table of contents