Voice Management Guide
The Voice Management user guide
- To start
- Prerequisite
- Home
- Administrator
- Importing sounds to your IVR
- Creating a routing
- Importing a directory
- Prohibit transfers to certain numbers
- Creation of a skill group
- Creation of an operator toolbar
- Gestion of an operator
- Creation of an IVR
- Satisfaction survey
- Campaign
- Webcallback
- Link WebCallBack
- Generating a WebCallBack link
- Gestion of a supervisor
- SMS service
- SMS in the operator toolbar
- SMS in the operator toolbar
- Statistics
- Operator
- Supervisor
- Technical side
- API
- SSO authentification
- Call recording
- Integration
- Application setup (Microsoft Dynamics)
- easiware integration
- Salesforce
- Zendesk
Dynamic statistics
1 - What is Dynamic statistics
Find all of the data pertaining to the activity of your contact centre in tables, which you can build, change and import as you like.
Our dynamic statistics tool is a pivot table that will allow you to create tables that meet your requirements.
Go to “Dynamic Stats”, in the menu on the left. A sub-menu will appear with:
A page is a collection of rows. Each row contains the statistics that you have created. You have the ability to compile these statistics in table form or in the form of a graphic. Each administrator will see his/her own page and his/her own tables.

1. New Page: Create as many tables as you like, with as many statistics tables as you want.
2. Find 6 pages created by default: Incoming calls, Outgoing to routing, Campaigns, Operators, Transfers, Groups. These pages are currently set as favourites. To remove them or set which pages you want, please go to your created pages and click on “Favourites”. Any page set as a favourite will appear in the menu on the left.
3. Personalised page: Find all of the pages that you have created.
The dynamic statistics are updated once daily.
New page
To create a new page of statistics, click on “New page”.
Give it a name by typing into the field on the left.
Once you have named your page, you have the ability to open a new, clean table page, or to open a page with tables that have been pre-configured.
To open a page without a table, type the name of your page and then click directly on “Validate”.
To open a page with pre-configured tables, type the name of the page and then select a page in the “Select a page” drop-down list. In this list you will find all of the tables that Axialys provides, or all of the tables that you have previously created and saved.
3 - Tools for modifying a page
Once you have validated your new page, its name will appear at the top of the page. You will then have several tools at your disposal:
Overview/Edit: When you are in overview mode, you are not able to make any modifications. Click on Edit mode to modify your pages.
Save: Each change made to your tables is saved automatically, however, you also have the ability to save manually.
1/2/3-column templates: To insert a table of statistics, click on the template that you want. The 1-column template means you will have a single table column, whereas the 2 or 3-column templates will allow you to have 2 or 3 statistics tables respectively.
Favourites: This will allow you to set your statistics pages as favourites, in the menu on the left, so as to access them with just one click. If you do not set a page as a favourite, it will be stored under “Personalised pages”
Delete: You can delete the page in its entirety, or row-by-row.
4 - Creating a table
Once you have clicked on “1-column template” to add a statistics table to your page, a new row will appear with a blank table.
Information in the table:
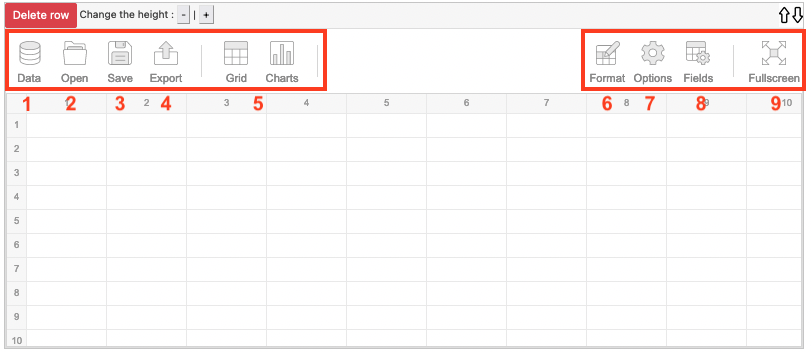
Data: Import the sources of data that you wish to see appear in your table.
Open: Import a table.
Save: Save your table and assign it a name.
Export: Export your table in whatever format you want.
Table/Graphic: Display your data in table form or in the form of graphics.
Format: You can build your table and to make changes to it, e.g. to the format of the cells. You can change the formatting of your table, for example, by electing to turn all figures less than 3 red.
Options: Decide whether or not to display certain information.
Fields: Create the table you want based on raw data.
Full screen: Display your table full screen.
Inserting data into a table:
Click on “Data” to insert your raw data into your table. The data has been grouped into categories to facilitate the construction of the tables. Select the desired resource. A default table will appear with the data.
You can import resources for 7 or 40 days, or for 1 year:
Incoming calls
Routings
Campaigns
Groups
Transfers
Outgoing calls
Operators
Within each piece of data, there is a group of fields. A field is a piece of data, such as the number of incoming calls, the status of a call, the communication time…
If you wish to change the default table, click on “Fields”.
A pivot table opens. On the left you have the list of all of your raw data, that is, the number of calls, the dates, the duration of the calls…
In the area on the right, the pivot table allows you to position the data in your table:
Filters: The data in the filters will appear at the top of the table. As the heading suggests, this allows you to filter the data. For example, you can set the year, the month and the day, so that you can then filter the dates once the table is made.
Rows: The data in the rows are the fields for which you want data. E.g. if you want the number of calls per operator: you must place the operator field in rows and “No. of incoming calls” in values.
Values: The data under values are the values (totals, percentages…) corresponding to the rows.
In the list of fields, there is a “Calculated values” step. These are values that are not “raw”. For example, there you can find the calculation of the average communication time, the % of calls picked up… Some calculations are made by default by Axialys, however, you can create them yourself by clicking on “Add calculated values”.
All you have to do is click to check the box for the piece of data that you want (the data will be placed in the table by default).
If you are not satisfied with the default positioning, you can “Drag & Drop” to reposition the data: select it with your mouse and move it to a suitable position.
To name your table, click on “Backup”, then “Save”, and enter a name for your table in the field. Then save it.
5 - Creating new data
Axialys provides raw data. We offer this directly processed data in the “All fields” column, which may be in “raw” form or in the form of “Calculated values”.
You might be missing a value. To calculate a new value, click on “Add calculated values”. You can then give this new calculated value a title (beginning with Time/Duration…), then select the desired data.
Select your first piece of data, click on the symbol for the calculation that is of interest to you, then select another piece of data. If you have to perform a calculation with multiple symbols, don’t forget to use brackets. Once the calculation has been established, click on “Apply”. You will find your new value at the bottom of the “Field” list.
Calculation of a percentage of a piece of data:
To calculate the percentage of a piece of data, click on “Add calculated values”. Select a value and click on “select an aggregation”. Select “Percent”. Don’t forget to name your new value. This new value will then be found in the calculated values. Once in the table, select the desired column and click on “Format cells “. Under “Format as a percentage”, select “True”. You can also modify decimals.
Examples:
Calculation of the % of pick-ups
> In calculated values: (don’t forget to name the formula) take “Number of calls” with the aggregation “% of the total of the parent row” (if you have sub-groups) or “Percent”(if you only have one row), then divide by 100, which produces the following formula:
percentofparentrowtotal(“no_calls”) /100
> Execute “Format cells” on the column concerned
> Under “Format as percentage” select “true”
> You can also format decimals.
Calculation of the % of call transfers – you must go to the operator source and calculate a calculated value as follows:
sum(“no_trans_calls”) / (sum(“no_incoming_calls”) + sum(“no_outgoing_calls”) )
> In calculated values: (don’t forget to name the formula) take “No. of transfers (Sum) along with “No. outgoing (Sums)” + “No. incoming calls (Sum)” thus: No. of transfers / (No. outgoing + No. incoming calls).
> Execute “Format cells” on the column concerned
> Under “Format as percentage” select “true”
> You can also format decimals.
Note: In the statistics for the Steps, the number taken into account is the number of people for whom the routing on the IVR ended on the step in question.
6 - Personalising the Waiting time ≤ X secs columns
In the Incoming calls resource, there are two pieces of data that you can personalise. For the two Waiting time ≤ X secs columns, you can indicate the required time.
The two sources are to be coupled with the “Call status” source. Apply the “Call status” source in the “Rows” box and “Call status” in the “Values” box. Once your table has been validated, you will find the various call statuses, as well as the number of calls that ended up with this status (picked up, cancelled, missed…) after X seconds (whatever time you have customised).
You can of course only use one of the two sources.
By default, the times for these columns are set to 5 seconds and 45 seconds. If you have other requirements relating to these times, please contact your Customer Manager at the following address: [email protected].
7 - Receiving the page by email
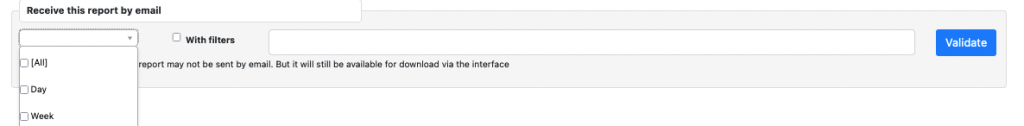
You can receive pages by email. To do so, go to the bottom of the page and select your sending frequency: daily, weekly and/or monthly.
You can set several email addresses – when doing so, they must be separated by “,”. To erase an email address all you have to do is delete it and click on “Validate”. For each change of frequency or email address, please save the change by clicking on “Validate”.
To build your tables, you have imported 7-day, 40-day or 1-year sources. When you enter a frequency, you must follow the same logic as your sources. As a matter of fact, if you choose a monthly frequency and there is a table with a 7-day source, you will still receive the 7 days previous to the sending of the email.
For each frequency, the email is sent as follows:
Monthly: on the 1st of the month, for the previous month,
Weekly: on Monday, for the previous week,
Daily: the data from the day before.
Webinar
- Table of Contents